|
 The
Republic of Malta’s territory comprises an archipelago of seven
islands for a total land of 320 Km2, only the three largest islands
are inhabited by about 400 000 people. The country is located in the
Mediterranean Sea, off the south coast of Sicily (Italy), the East
coast of Tunisia and the North coast of Lybia. The length of
continental coastline is 140 km. Malta lies in the FAO-GFCM
Geographical Sub Area 15. The
Republic of Malta’s territory comprises an archipelago of seven
islands for a total land of 320 Km2, only the three largest islands
are inhabited by about 400 000 people. The country is located in the
Mediterranean Sea, off the south coast of Sicily (Italy), the East
coast of Tunisia and the North coast of Lybia. The length of
continental coastline is 140 km. Malta lies in the FAO-GFCM
Geographical Sub Area 15.
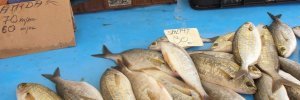
Maltese fishery is mainly artisanal, with a large number of
multi-gear vessels, while the industrial fisheries is not so
significant. The earnings for fishermen depend on the high quality
of fish products, which are very appreciated by the tourists.
Fishing effort is, in fact not homogenious over the year: during the
winter the reduction observed is about 75 percent.
About 60 percent of catches are pelagic fishes (tunas, dolphin fish,
swordfish), caught with drifting long lines, and trolling lines. One
of the most important fisheries in Malta is for the dolphinfish Coryphaena hippurus.
This species is targeted by means of a special type of surrounding
net similar to a purs seine, however the net is not closed at the
bottom. A trolling line is also used to catch fish around Fish
Aggregating Devices (FADs). When a fish is caught this is lured
around the FADs and any schools of dolphinfish around the FAD follow
the fish caught by the trolling line. After this the FAD together
with the school of fish is encircled by the net. Studies have shown
that this target catch is mainly composed of Dolphinfish (Coryphaena
hippurus), juvenile amberjack (Seriola dumerili), pilot
fish (Naucrates ductor) and juvenile Wreck fish (Polyprion
americanus). However during the fishing activity fishermen also
use considerably the trolling line either to catch fish to be
eventually surrounded by the net or to catch Dolphinfish when moving
from one FAD to another.
Aquaculture in Malta is primarily marine-based, taking place in
floating cages. It consists on the fattening of wild-caught bluefin
tuna (exported mainly to Japan), as well as the culture of European
seabass and gilthead seabream (exported to Europe, mainly Italy).
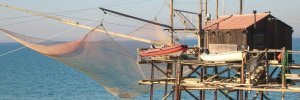
The fleet is mainly composed by traditional small artisanal vessels,
less than 10 m LOA. The oldest are almost wholly wooden, while the
more recent multi-purpose ones are fiberglass made.
Malta domestic fisheries product in 2006 was approximately 3 537
tonnes, 2 411 of which from capture fisheries and 1 126 from
aquaculture.
Fishery imports in the period May 2004-2005 totalled an annual
average of about 26 800 tonnes, while fish exports stood at 2 207
tonnes.
Fishery imports in 2006 totalled about 32 109 (1 000 USD) while
exports was 64 421 (1 000 USD) with a net balance of 32 312 (1 000
USD). In 2003-2005, average per capita supply was 31.2 kg/year.
(FAO, 2008).
|