|
|
|
|
|
|
|
|
COUNTRY FISHERY INFORMATION: ITALY |
|
|
|
|
|
| |
|
GENERAL STATISTICS |
pdf format
 |
|
Area (kmq) |
301230 |
|
geographic coordinates |
42 50N, 12 50E |
coastline (inclusive of Ionian and Tyrrhenian coastline) (km)
 |
7600 |
|
GENERAL ECONOMIC DATA |
|
|
population (millions 2005 est.)* |
58.6 |
|
annual population growth rate (1975-2005)* |
0.2% |
|
gross domestic product (GDP per capita annual growth rate)
(1990-2005)*
|
1.3%
(on a period shorter than that specified) |
| education
index, 2005* |
0.958 |
|
human development index (HDI) value, 2005*
|
0.941 |
|
urban population (as % of total) 2005*
|
67.6 |
|
infant mortality rate (per 1.000 live births) 2005*
|
4 |
|
internet users (per 1.000
people) 2005**
|
480 |
|
personal computers (per 1.000 people) 2005 est.** |
370 |
|
agriculture, value added (% of GDP) 2005 est.**
|
2 |
|
industry, value added (% of GDP) 2002 est.**
|
27 |
|
services, etc., value added (% of GDP)2005 est.**
|
71 |
|
|
 Italy
is a peninsula situated in Southern Europe which projects into the
central Mediterranean Sea covering an area of 301 230 square
kilometres. The territorial waters are extended up to 12 nautical
miles (22 km) from the coastline. Italy has a population of about 58
million of inhabitants. Fishing activity takes place along the
entire coastline. Adriatic waters of Italy lie in the FAO-GFCM
Geographical Sub Area 17 and 18. Italy
is a peninsula situated in Southern Europe which projects into the
central Mediterranean Sea covering an area of 301 230 square
kilometres. The territorial waters are extended up to 12 nautical
miles (22 km) from the coastline. Italy has a population of about 58
million of inhabitants. Fishing activity takes place along the
entire coastline. Adriatic waters of Italy lie in the FAO-GFCM
Geographical Sub Area 17 and 18.
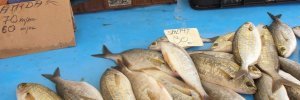
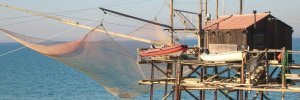
The Italian fishery sector presents the following characteristics:
predominance of small and relatively old vessels, wide distribution
of the fleet along the coastline, fragmentation of landing sites and
sales, high degree of polyvalent techniques.
The Italian aquaculture output in 2006 amounted to 173 000 tonnes
with a total value of over 500 million EUR. Mollusc production
accounts for over 69 percent of the total, made up of 62 000 tonnes
of mussels and 57 000 tonnes of Manila clams (FAO, 2008).
Italy’s domestic fisheries production in 2006 was approximately 488
519 tonnes of which 315 436 tonnes from capture fisheries and 173
083 tonnes from aquaculture.
In addition, fishery imports in 2003-2005 totalled an average of
about 1 162 234 tonnes in live weight, while fish exports stood at
177 778 tonnes. In 2003-2005, average per capita supply was 4.5
kg/year. (FAO, 2008).
Fishery imports in 2006 totalled about 4 716 917 (1 000 USD)
while exports stood at 714 760 (1 000 USD) with a net balance of -4
002 157 (1 000 USD).
In 2003-2005, average per capita supply was estimated at being 24.1
kg/year. (FAO- Yearbook of Fishery Statistics, 2009)
Italy has a fishing fleet of about 13 816 boats with total GRT of
194 820 distributed along the Italian coast (source MIPAAF, 2009).
In 2003 imports totalled 817 000 tonnes, 73 percent of which
constituted fresh or frozen products (601 000 tonnes for a value of
2 194 millions EUR), 216 000 tonnes of processed products for a
value of 902 millions EUR. Exports amounted to 114 000 tonnes, 78
percent of which were fresh products (89 500 tonnes for a value of
281 millions EUR), 25 000 tonnes of processed products (166 mln
millions EUR) (source ANCIT, 2003).
|
|
|
|
|
FISHERIES DATA |
|
|
total fisheries production (t) 2006*** |
488519 |
|
capture production (t) 2006*** |
315436 |
|
aquaculture production (t) 2006*** |
173083 |
|
per caput fish supply (kg/year, 2003-2005)*** |
24.1 |
|
production (tonnes in live weight) 2003-2005*** |
457181 |
|
non-food uses (tonnes in live weight) 2003-2005*** |
31529 |
|
imports (tonnes in live weight) 2003-2005*** |
1162234 |
|
exports (tonnes in live weight) 2003-2005*** |
177778 |
|
food supply (tonnes in live weight) 2003-2005*** |
1410107 |
|
imports (US$ 1.000) 2006*** |
4716917 |
|
exports (US$ 1.000) 2006*** |
714760 |
|
net balance 2006*** |
-4002157 |
|
fishery exports as a percentage of agricultural exports (%)
2003*** |
11.7 |
|
fishery exports as a percentage of total merchandise exports (%)
2006*** |
0.2 |
|


Source: FAO – FISHSTAT
|
|
| |
| |
|
|
 |
|
REFERENCES |
|
· |
FAO-. 2008. Fisheries and Aquaculture Information
and Statistics Service. Fishery and Aquaculture
Statistics 2006. 57p. |
|
· |
FAO. © 2006-2009. National Aquaculture Sector
Overview. Aperçu général du secteur national
d'aquaculture - France. National Aquaculture Sector
Overview Fact Sheets. Texte par Lacroix, D.
In: FAO Fisheries and Aquaculture Department
[en ligne]. Rome. Mis à jour 25 July 2005. [Cited 11
June 2009]. |
|
|
|
|
|
|